
In meta-analyses of outcomes that utilize multiple scales of measurement, a standardized mean difference (SMD) may be used. Randomized controlled trials may also use SMDs to help interpret the effect size for readers. Most commonly, the SMD reports the effect size with Cohen's d, a metric of how many standard deviations are contained in the mean difference within or between groups (e.g., an intervention caused the outcome to increase or decrease by x number of standard deviations, or the two groups were x number of standard deviations different from one another with regards to the outcome). This is typically done by dividing the difference between groups, or from pretest to posttest in a single group, by some form of standard deviation (e.g., pooled standard deviation at baseline, posttest, or the standard deviation of change scores). Cohen's d is often utilized because a general rule of interpretation has been suggested: 0.2 is a small effect, 0.5 is a medium-sized effect, and 0.8 is large.
However, there are multiple ways to approach the calculation of SMDs, and these may result in varying interpretations of the size of the effect. To further investigate this, Luo and colleagues recently published a review of 161 articles using SMDs and the way they can be calculated. Of the 161 randomized controlled trials published since 2000 and reporting outcomes with some form of SMD, the authors calculated potential between-group SMDs using reported data and up to seven different methodological approaches.
Some studies reported more than one type of SMD, meaning that 171 total SMD approaches were reported across the 161 studies. Of these, 34 (19.9%) did not describe the chosen method at all, 84 (49.1%) reported but in insufficient detail, and 53 (31%) reported the approach in sufficient detail. The confidence interval was only reported for 52 (30.4%) of SMDs. Of the 161 individual articles, the rule for interpretation was clearly stated in only 28 (17.4%).
The most common method of calculating SMD was using a standard deviation of baseline scores, seen in 70 (40.9%) of studies. Meanwhile, 30 (17.5%) used posttest standard deviations and 43 (25.1%) used the standard deviation of change scores.
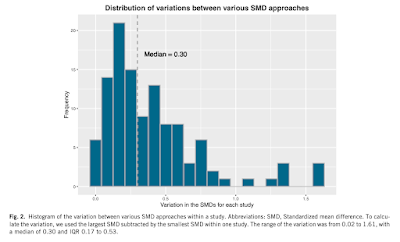 |
Figure displaying the variability of SMD estimates across 161 included studies. Click to enlarge. |
Of all the potential ways to calculate SMD, the median article varied by 0.3 - which could potentially be the difference between a "small" and "moderate" or "between a "moderate" and "large effect size for Cohen's d using Cohen's suggested rule of thumb. The studies with the largest variation tended to have smaller sample sizes and greater reported effect sizes.
This work raises an important point, which is that while no one method for the calculation of SMDs is considered superior to another, if calculation approaches are not prespecified by researchers, different methods could be tried until the most impressive effect size is reached. To help prevent these issues, the authors suggest prespecifying the analytical approach and reporting SMDs together with raw mean differences and standard deviations to further aid interpretation and provide context.
Luo, Y., Funada, S., Yoshida, K., et al. (2022). Large variation existed in standardized mean difference estimates using different calculation methods in clinical trials. J Clin Epidemiol 149: 89-97. Manuscript available at the publisher's website here.